The LM relation
The downward sloping money demand curve can be written like this: 
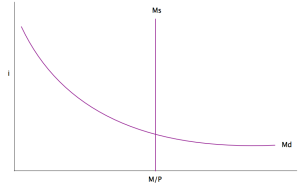
L(i) determines the steepness of the curve, and Y determines where the curve is, if you increase Y, then you push the whole curve up. This is the principle behind the LM relation. We can basically think of a relationship between i, the nominal interest rate, and Y, the level of income in the economy. As Y increases, then you shift up the money demand curve, so if you keep the money supply constant (the vertical line) then the point of intersection on the diagram is higher. This means that the new interest rate which brings the money market into equilibrium (money supply = money demand) is higher. So if money supply is constant, increasing Y means you get an increase in i; decreasing Y means you get a decrease in i. This is the LM relation – and it is upward sloping:

Think of movements along the LM curve as being what happens when you shift money demand curve up and down in the money supply/money demand diagram. Higher Y means money demand shifts up so you get higher i in equilibrium, that’s a movement up the LM curve.
What shifts the LM curve up or down is movements in the money supply curve. If you shift the money supply curve out (to the right) on the money supply/money demand diagram then you will get a lower i in equilibrium, at all levels of income, that’s the equivalent to shifting the LM curve down. If you shift the money supply curve in (to the left) on the money supply/money demand diagram then you will get a higher i in equilibrium at all levels of income, that’s the equivalent to shifting the LM curve up.
Remember that prices also affect the position of the money supply curve, because we are thinking about real money balances (M/P). As P is on the denominator, an increase in P makes (M/P) smaller, so an increase in P (rising prices) has the same effect as a decrease in M (reducing nominal money supply), so it moves the money supply curve to the left.
So to sum up:
The LM curve is upward sloping, as income in the economy increases, the interest rate increases
The LM curve shifts down when there is an increase in nominal money supply (a monetary expansion) or a fall in prices (rare!)
The LM curve shifts up when there is a reduction in the nominal money supply (a monetary contraction) or a rise in prices (inflation)
The Central Bank can stop inflation from pushing the LM curve up and increasing interest rates, by increasing nominal money supply in a proportionate amount that keeps (M/P) constant when P is rising.
